Operation Safe Driver Week serves as a crucial reminder of the ongoing challenges faced on our roads today. This annual initiative, organized by the Commercial Vehicle Safety Alliance, aims to raise awareness about the alarming rates of speeding, distracted driving, and impaired driving—issues that continue to contribute to unnecessary accidents and fatalities.
The statistics speak volumes; recent reports indicate that a staggering percentage of traffic deaths are linked to speeding and that distracted driving has become one of the most pressing dangers on the road. With thousands of vehicles being pulled over and substantial citations being issued each year, it is imperative to recognize the urgency of addressing these violations.
As we embark on this campaign, we must collectively advocate for safer driving practices to protect not just drivers, but everyone on our roads. The time to act is now, as each moment spent overlooking these critical issues can have dire consequences.
Top Violations Identified During Operation Safe Driver Week
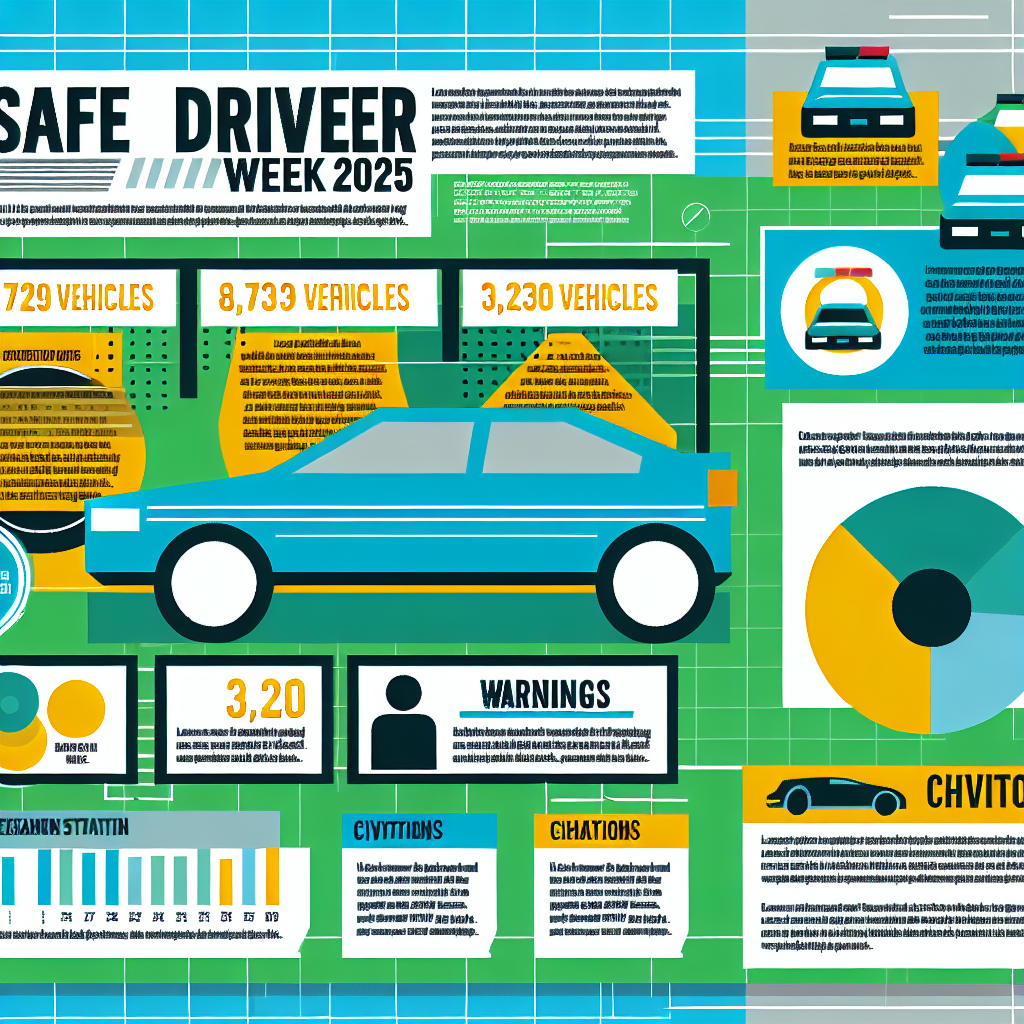
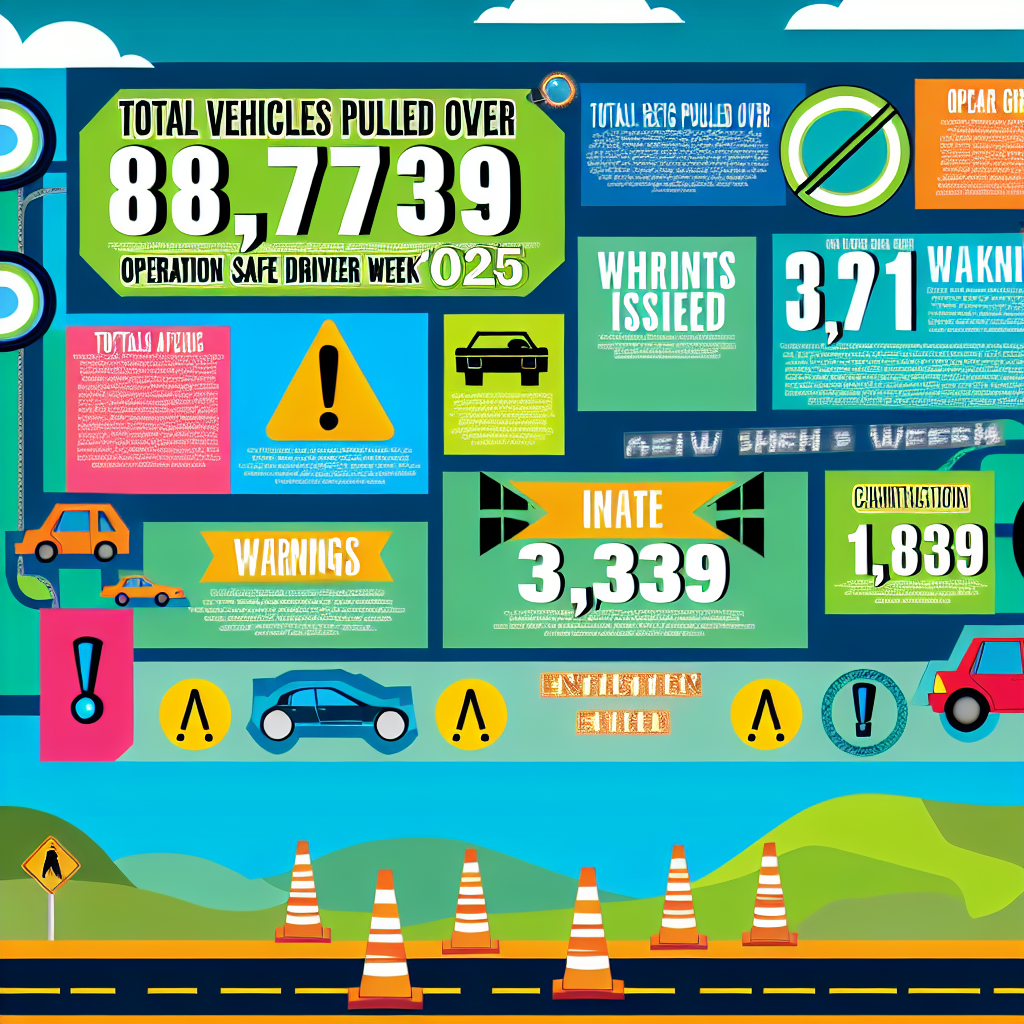
During Operation Safe Driver Week 2025, which took place from July 13 to 19, law enforcement agencies across Canada and the United States took significant steps to enhance road safety. This initiative aimed at addressing unsafe driving behaviors led to the pulling over of 8,739 vehicles, resulting in 3,575 warnings and 2,504 citations being issued.
Key Violations and Statistics
- Speeding
- Total Violations: 1,249 warnings and 917 citations.
- Breakdown: 1,073 warnings and 491 citations were issued to commercial motor vehicle (CMV) drivers, while passenger vehicle (PV) drivers received 176 warnings and 416 citations.
- Speeding continues to be a significant factor in road accidents, with recent statistics indicating that it was involved in 29% of all traffic deaths in the United States, and in Canada, it accounted for 25% of roadway fatalities.
- Failure to Wear a Seat Belt
- Total Violations: 219 warnings and 264 citations.
- Breakdown: CMV drivers received 204 warnings and 248 citations for not buckling up, while PV drivers were issued 15 warnings and 16 citations. This violation is critical, as the National Highway Traffic Safety Administration (NHTSA) states that about 14% of commercial drivers do not use seat belts.
- Distracted Driving (Texting/Handheld Device Use)
- Total Violations: 129 warnings and 116 citations.
- Breakdown: CMV drivers saw 107 warnings and 79 citations, while PV drivers incurred 22 warnings and 37 citations. With distracted driving on the rise, it remains a growing concern for road safety.
- Reckless/Careless/Inattentive Driving
- Total Violations: 53 warnings and 20 citations.
- CMV drivers accounted for 47 warnings and 12 citations while PV drivers received 6 warnings and 8 citations.
- Impaired Driving
- Total Violations: 18 warnings and 27 citations.
- CMV drivers received 14 warnings and 22 citations due to drug or alcohol influence, highlighting the importance of monitoring driving under impairment.
The enforcement actions taken during Operation Safe Driver Week reinforce the ongoing challenges of promoting safe driving practices. Law enforcement’s efforts to educate drivers and combat these violations are critical in reducing road incidents and enhancing public safety.
Insights on Speeding Statistics
Speeding remains a critical issue in terms of road safety, consistently recognized as one of the top violations contributing to traffic fatalities in North America. In the United States, speeding was a factor in 12,151 deaths in 2022, which translates to approximately 29% of all traffic-related fatalities. This represents a slight decrease from the previous year, but the numbers remain alarmingly high, showing that speeding continues to be a major threat on the roads.
Key Statistics on Speeding and Safety
- Traffic Fatalities:
- Speeding was involved in 12,151 deaths in the U.S. in 2022.
- It accounted for approximately 29% of all traffic-related fatalities.
- State Variations:
- Rhode Island: 48% of traffic fatalities attributed to speeding.
- Florida: 11% rate of fatalities linked to speeding.
- Canada’s Challenge:
- Speeding linked to 24% of all fatal collisions.
- Young Drivers’ Vulnerability:
- 40% of speeding-related fatalities involve individuals aged 16 to 24.
These statistics illustrate a persistent trend that emphasizes the need for ongoing vigilance and enforcement against speeding. The importance of addressing this leading cause of road accidents cannot be overstated. As one expert aptly states, “Speeding remains one of the most persistent causes of fatal collisions.” Thus, initiatives like Operation Safe Driver Week play a crucial role in targeting speeding violations, reinforcing the message that safe driving practices are imperative to saving lives.
| Violation Type | Vehicles Pulled Over | Warnings Issued | Citations Issued |
|---|---|---|---|
| Speeding | 8,739 | 3,230 | 1,839 |
| Distracted Driving | – | 129 | 116 |
| Impaired Driving | – | 18 | 27 |
| Total | 8,739 | 3,230 | 1,839 |
Note: The numbers for distracted and impaired driving are provided as part of the detailed breakdown, reinforcing the importance of addressing these major violations during Operation Safe Driver Week.
Insights on Speeding Statistics
Speeding remains a critical issue in terms of road safety, consistently recognized as one of the top violations contributing to traffic fatalities in North America. In the United States, speeding was a factor in 12,151 deaths in 2022, which translates to approximately 29% of all traffic-related fatalities. This represents a slight decrease from the previous year, but the numbers remain alarmingly high, showing that speeding continues to be a major threat on the roads.
Key Statistics on Speeding and Safety
-
Traffic Fatalities:
- Speeding was involved in 12,151 deaths in the U.S. in 2022.
- It accounted for approximately 29% of all traffic-related fatalities.
-
State Variations:
- Rhode Island: 48% of traffic fatalities attributed to speeding.
- Florida: 11% rate of fatalities linked to speeding.
-
Canada’s Challenge:
- Speeding linked to 24% of all fatal collisions.
-
Young Drivers’ Vulnerability:
- 40% of speeding-related fatalities involve individuals aged 16 to 24.
These statistics illustrate a persistent trend that emphasizes the need for ongoing vigilance and enforcement against speeding. The importance of addressing this leading cause of road accidents cannot be overstated. As one expert aptly states, “Speeding remains one of the most persistent causes of fatal collisions.” Thus, initiatives like Operation Safe Driver Week play a crucial role in targeting speeding violations, reinforcing the message that safe driving practices are imperative to saving lives.

Seatbelt Violations Statistics
Seatbelt use is a key factor in ensuring road safety, yet violations remain prevalent across the country. Each year, law enforcement agencies issue thousands of warnings and citations for failures to wear seatbelts, a critical violation that significantly impacts traffic safety.
National Overview of Seatbelt Enforcement
During Operation Safe Driver Week 2025, law enforcement issued 264 citations for seatbelt violations. Of these, 204 citations targeted commercial drivers, highlighting a concerning trend in compliance within this demographic.
This follows a consistent trend where commercial drivers have shown lower seatbelt usage rates compared to their passenger vehicle counterparts. According to the National Highway Traffic Safety Administration (NHTSA), approximately 14% of commercial drivers do not wear seatbelts. This statistic raises alarm as it underscores the urgent need for targeted interventions and educational campaigns aimed at this group.
Recent Seatbelt Violation Statistics
- New York Enforcement Campaign (2024): In New York alone, during the “Buckle Up New York, Click it or Ticket” campaign, law enforcement issued 15,049 tickets for seat belt and child restraint violations (dmv.ny.gov).
- Ohio’s 4th of July Weekend (2025): Similarly, over the Independence Day weekend, the Ohio State Highway Patrol cited 2,286 violations related to seat belts and child safety seats (axios.com).
Trends in Seatbelt Usage
National seatbelt use among all vehicle occupants was observed at 91.2% in 2024; however, this reflects a slight decrease from 91.9% in 2023 (ghsa.org). Alarmingly, in 2023, 44% of the passenger vehicle occupants killed in crashes were not wearing seatbelts at the time (ghsa.org).
These statistics are clear indicators of the need for increased enforcement and educational initiatives aimed at improving seatbelt compliance amongst all drivers, with a focused challenge for the commercial driving sector. By elevating awareness and encouraging consistent seatbelt use, we can work towards reducing fatalities and serious injuries resulting from traffic crashes.
In conclusion, enforcement operations such as Operation Safe Driver Week are vital for fostering safer road conditions and mitigating the dangers associated with reckless driving. The alarming statistics that reveal 8,739 vehicles were pulled over, resulting in 3,230 warnings and 1,839 citations, reflect the pressing need to address infractions head-on. Notably, speeding emerged as the most common violation, with nearly 2,200 combined warnings and citations, underscoring its role as a major factor in traffic fatalities.
Statistically, speeding was involved in 29% of all traffic deaths in the U.S., and in Canada, it was linked to 25% of roadway fatalities. The enforcement efforts aim not just to punish violations but to deter reckless behaviors, ultimately saving lives. The recurring findings indicating that many commercial drivers neglect to use seatbelts—approximately 14%—further highlight the necessity of steadfast enforcement practices aimed at improving compliance and awareness.
Given these insights, it is imperative for law enforcement agencies to maintain and enhance their efforts to regulate driver behavior rigorously. Each citation issued is a step towards reducing accidents and protecting not only the drivers but also all those who share the road.
The impact of these violations can be devastating, as exemplified by the story of the Nalepa family. In Texas, an incident involving a drunk driver led to the tragic loss of 8-year-old Kelsey Nalepa, who sustained severe brain injuries in the collision and passed away shortly after. Her mother, Nicole, emphasizes the importance of making safe choices to prevent such tragedies from occurring. “There are so many other alternatives to help prevent a tragedy—like the one that happened to my family—from happening to yours,” she said. This heartbreaking example underscores the real-world consequences of impaired driving, reminding us that consistent enforcement is essential.
As we advocate for continued vigilance and legislative support for such initiatives, it becomes evident that the future of road safety greatly depends on our collective commitment to enforcing driving laws effectively.
Driver Attitudes Towards Safety Enforcement Measures
Operation Safe Driver Week has become a pivotal initiative aimed at enhancing road safety by tackling unsafe driving behaviors. The 2025 campaign saw law enforcement officers across Canada and the U.S. stop 8,739 vehicles, leading to 2,504 citations and 3,575 warnings issued to both commercial and passenger vehicle drivers. Significantly, speeding emerged as the prevalent violation.
Effectiveness of Safety Enforcement Measures
Research consistently demonstrates that high-visibility enforcement (HVE) campaigns, such as Operation Safe Driver Week, effectively mitigate risky driving behaviors. According to a study by the National Highway Traffic Safety Administration (NHTSA), HVE efforts can lead to measurable improvements in roadway safety by diminishing behaviors such as speeding, distracted driving, and impaired driving. This highlights the vital role these campaigns play in fostering a safer driving environment.
Public Perspectives on Enforcement
However, attitudes towards these enforcement measures are complex. Public acceptance of traffic enforcement varies widely and is influenced by factors such as cultural norms, privacy issues, and trust in the technology used for enforcement. For instance, a recent study exploring cross-cultural perceptions of AI-enhanced traffic surveillance found that while many people prefer traditional methods, acceptance of AI measures differs significantly between regions. This underscores the need to consider societal perspectives when implementing enforcement technologies.
User Adoption and Acceptance of Safety Enforcement Measures
The adoption of safety monitoring systems, which can detect alcohol impairment and distractions, faces unique challenges. Privacy concerns, perceived intrusiveness, and trust in the effectiveness of these monitoring systems are critical factors. Surveys indicate that many drivers favor non-intrusive monitoring practices, emphasizing the importance of addressing privacy issues to encourage acceptance. Transparent and reliable safety enforcement technologies are essential in building public trust and promoting wider adoption.
In summary, Operation Safe Driver Week has successfully identified and mitigated unsafe driving behaviors through robust enforcement measures. While such campaigns have demonstrated effectiveness in increasing compliance and improving road safety, achieving widespread public acceptance remains a challenge. The focus must now shift towards understanding and addressing societal attitudes, privacy concerns, and trust in enforcement technologies to enhance the impact of future safety initiatives.
Authoritative Outbound Links for Section 6
- Operation Safe Driver Week Statistics: Learn more about the results and statistics from the 2025 Operation Safe Driver Week, including total vehicles stopped and key violations noted during the campaign, at the Commercial Vehicle Safety Alliance (CVSA) official page.
- Distracted Driving Concern: For more information on the prevalence of distracted driving in North America and law enforcement efforts, check the National Highway Traffic Safety Administration (NHTSA) website.
- Impaired Driving Statistics: Information regarding impaired driving incidents and enforcement measures can be found at the Centers for Disease Control and Prevention (CDC) and the Statistics Canada.
- Enforcement Measures in Canada: The Reduce Impaired Driving Everywhere (RIDE) program and its impact on impaired driving in Canada is discussed at Wikipedia.
These authoritative sources provide additional credibility to the discussions on law enforcement operations during Operation Safe Driver Week.